Installing Prometheus and Grafana on Kubernetes
Running a Kubernetes cluster means having the ability to check metrics from the terminal at any moment. But a visual interface that also tracks historical data makes a significant difference in day-to-day operations.
That is where Prometheus and Grafana come in.
Prometheus
Prometheus is an open-source time-series database built for metrics collection and monitoring. It handles the collection, storage, and querying of Kubernetes metrics. Its extensible architecture also supports logs and data from other services through exporters and plugins.
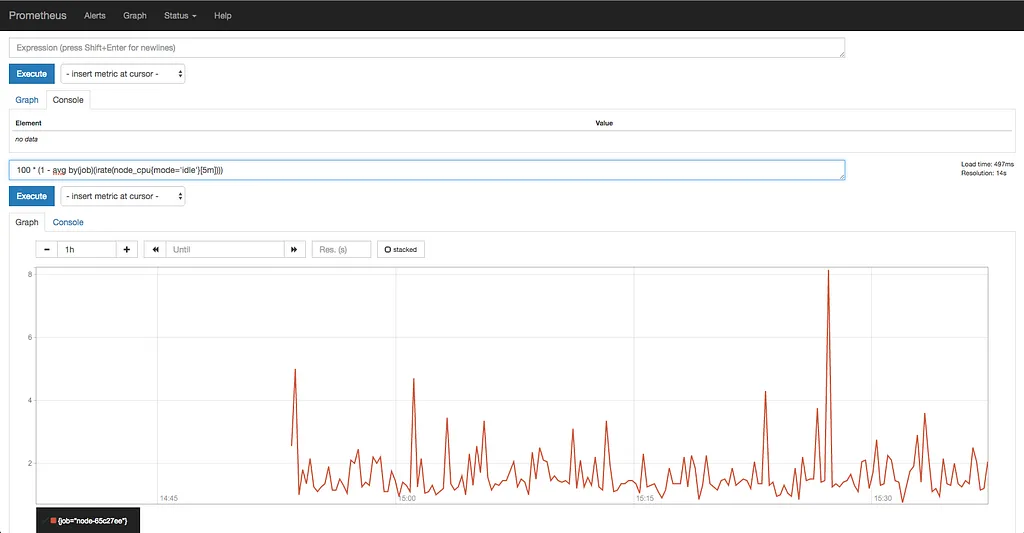 Source: prometheus.io
Grafana
Grafana is the visualization layer for the data stored in Prometheus. It provides querying and dashboarding capabilities right out of the box. The pre-built dashboards included with the kube-prometheus-stack make it easy to spot anomalies in cluster health, resource usage, and application performance.
With Grafana, there is no need to build charts from scratch. The default dashboards cover node metrics, pod metrics, Kubernetes component status, and more.
Installation
We will use Helm, the de facto package manager for Kubernetes applications.
If Helm is not installed on your machine, check the official installation guide.
Step 1: Add the Helm Repository
First, add the Prometheus community Helm chart repository and update the index:
helm repo add prometheus-community https://prometheus-community.github.io/helm-charts
helm repo update
Step 2: Create a Namespace
Create a dedicated namespace for the monitoring stack:
kubectl create namespace monitoringStep 3: Configure Grafana with a Custom Values File
Create a file named grafana.yaml with the desired configuration. This file customizes the Grafana deployment inside the kube-prometheus-stack. Below is an example that configures an admin user, password, Ingress with a custom domain, and SMTP settings for email alerts.
grafana:
  adminUser: admin
  adminPassword: admin
  ingress:
    enabled: true
    hosts:
      - k8s.cluster.local
  smtp:
    enabled: true
    host: smtp.example.com:587
    user: alert@example.com
    password: your-password
    fromAddress: alert@example.com
    fromName: Grafana
  "grafana.ini":
    server:
      root_url: http://k8s.cluster.local/grafana
Adjust the domain, SMTP credentials, and admin credentials to match your environment.
Step 4: Install the kube-prometheus-stack
Run the following command to deploy the stack. This may take 5 to 10 minutes:
helm upgrade --install monitoring \
  --namespace monitoring -f grafana.yaml \
  prometheus-community/kube-prometheus-stack
Step 5: Access Grafana
Once the installation is complete, navigate to the following address in your browser:
http://k8s.cluster.local/grafanaLog in with the admin user and password set in grafana.yaml.
If you do not have a DNS record pointing to your cluster, add an entry to the
hostsfile on the machine running the browser. Map the domain (e.g.,k8s.cluster.local) to the cluster’s IP address.
What You Get
After logging into Grafana, head to the Dashboard section in the left sidebar. You will find a rich set of pre-configured dashboards:
| Dashboard | What It Shows |
|---|---|
| Kubernetes / Compute Resources / Cluster | CPU, memory, and disk usage across the cluster |
| Kubernetes / Compute Resources / Namespace | Per-namespace resource breakdown |
| Kubernetes / Compute Resources / Pod | Detailed pod-level metrics |
| Node Exporter / Nodes | Node-level hardware and OS metrics |
| Kubernetes / API Server | API server performance and request rates |
Alerts can also be configured based on custom rules. Prometheus handles the alert evaluation, and Grafana displays and routes notifications through channels like email, Slack, or PagerDuty.
Wrapping Up
In just a few steps, we have a fully functional Prometheus and Grafana stack running on Kubernetes. The kube-prometheus-stack bundles everything together: Prometheus for metrics storage, Grafana for visualization, and a set of pre-configured dashboards and alert rules.
This setup works well for both development clusters and production environments. Dashboards can be customized as needed, and new alert rules can be added through the Grafana UI or via configuration files in the Helm chart.
Happy monitoring. Enjoy your dashboards.
Originally published in Turkish on Medium
You can read this post in Turkish.